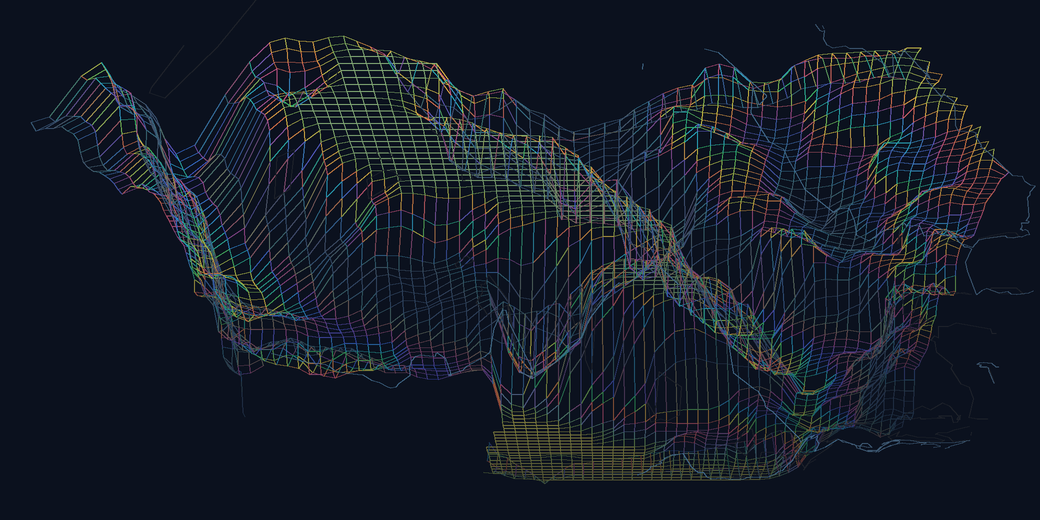
44.6°N 11.2°E
SUBSIDING
Bologna
- Median rate
- -4.0mm/yr
- LATEST EPOCH
- 2020-12-20
- Epochs
- 50
- Processing
- v1.8 EPSG:32632
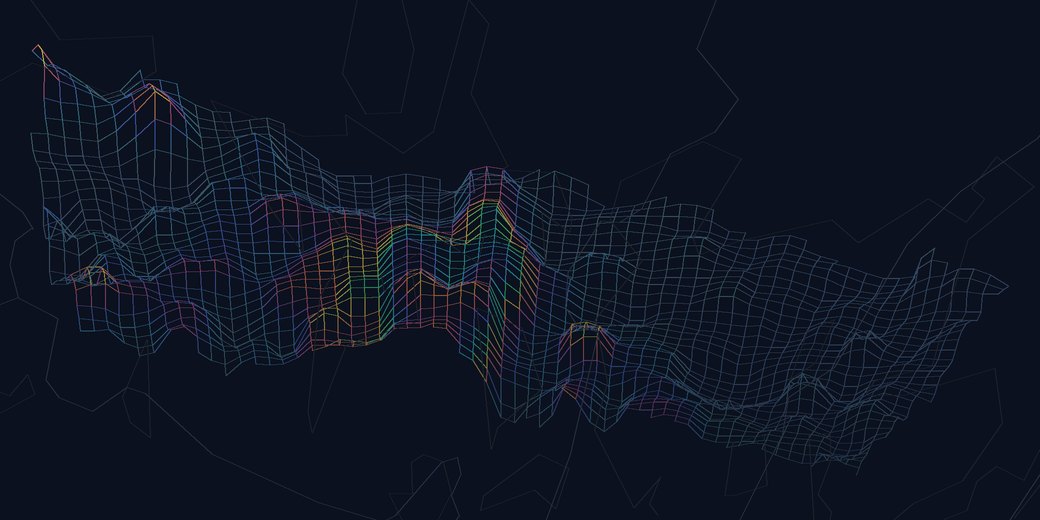
Sentinel-1 and OPERA DISP interferometry, resolved into per-point displacement histories and referenced to a stable datum. The terrain behind this text is real — it is the measured velocity field over Central Valley, wrapped into interferogram fringes.
Aquifers draw down, sediment compacts, mines and tunnels settle above themselves. The movement is real, it is continuous, and at a few millimetres a year it is invisible to everything except the right instrument. By the time it is visible, it is damage.
The instrument is orbital radar. Every repeat pass of Sentinel-1 over the same ground carries a phase measurement. Difference two passes and the change in that phase is the change in distance to the ground — at the scale of the radar's wavelength, which is centimetres. Stack years of those differences and the noise falls away, leaving a displacement history per point, in millimetres, with a date on every value.
Everything on this page is that measurement, and nothing else. No epoch is published without a processing version and a coverage manifest, and none reaches this platform until it clears the quality gate. Read the numbers as what they are: measured, dated, and reproducible.
Every card is a published release, and every wireframe is that region's own measured velocity field — the same data the hero is built from, wrapped into interferogram fringes. Colour appears only where the ground is actually moving. Sign in from any card and the viewer opens on that region's camera.
44.6°N 11.2°E
SUBSIDING
41.7°N 0.9°W
LOCALIZED
40.8°N 2.7°W
LOCALIZED
39.3°N 3.4°W
SUBSIDING
36.4°N 119.5°W
SUBSIDING
No roadmap items on this list. Each one is running in the stack that served you this page.
Sentinel-1 and OPERA DISP-S1 interferometry resolved into per-pixel displacement histories in millimetres, referenced to a stable datum and tied to GNSS where a station is in range.
No epoch reaches this platform unversioned. Each release carries its processing version and coverage in a manifest, and is held behind a quality gate until it passes — so a number you read today means the same thing next quarter.
Everything is served through WMS-T, WCS and STAC over Cloud-Optimized GeoTIFFs. No proprietary endpoint, no export step — the interfaces your GIS already speaks, reading the same rasters this page renders.
Click any pixel in the viewer and read its displacement history as a chart. Draw a polygon and aggregate it. The map is the query interface, not a picture of one.
Per-frame line-of-sight velocity for calendar year 2020, streamed straight out of Cloud-Optimized GeoTIFFs and tied to GNSS. Ascending and descending are published separately and deliberately: their rates are not the same physical quantity, so stacking them would be a category error.
13 descending · 10 ascending
Pick a region, click a point, and read its displacement history in millimetres — no export step, no GIS licence. Access is by account; talk to us about yours.